
To create new diagrams:
1. Right-click on the project explorer and select New diagram or press CTRL+D.
2. A new blank diagram will open in the workspace.
3. The Design ribbon is enabled. You may edit and add objects to the diagrams on the workspace:
•by selecting the desired option on the Insert tab on the Design ribbon and dropping the item on the diagram;
•or right-clicking on the existing diagram items or on the workspace.
To insert tables in a diagram:
To insert an existing table, drag and drop the desired table from the Project explorer to the Workspace.
To add all tables and their relationships, right-click the workspace and select Add all tables.
To add a new table, select Table on the Insert tab on the Design ribbon and release it into the Workspace.
You are able to edit the tables' properties by double-clicking on them, which opens a new Table editor tab on the Workspace.
Creating relationships
All existing relationships are automatically shown in a diagram when its related tables are inserted. To create new relationship between two tables the diagram:
1. Click Relationship or Non-ID Relationship on the Insert tab on the Design ribbon.
oNon-ID Relationship: This is the most usual type of relationship. It represents a weak connection, a relationship between parent and child table that does not involve a key field, such as the relationship between tables "Products" and "Categories", for example.
o(ID) Relationship: A relationship where the related fields from the child table are part of the key which identifies a unique record in this table. It indicates a strong connection, such as the relationship between tables "Order details" and "Products", for example. There are no "Order details" without a related "Product", and the "Product" is part of the key of the "Order details" table.
2. Drag a line from the Parent table to the Child table. Upon release, the Add relationship dialog will open.
3. On the Add relationship dialog, fill in with the relationship data:
In the Relationship properties section, you may visualize or set the relationship name and its description, for future reference. A default relationship name is created automatically when adding a new relationship to the project, combining parent and child table names. The relationship name may be edited at any time.
In the Relationship keys section you may visualize or edit the relationship keys by selecting them from the available list.
•Parent key: Lists all available keys (primary keys and indexes) from the parent table.
•Parent table: This column shows all fields on the parent table which are part of the selected parent key. It is not possible to modify this data.
•Child table: This column lists all fields on the child table that are compatible with the selected field on the parent table (same type). By default a new field listed as "field_name(new)" with the same name and type of the parent key is created and selected. It is possible to select any other available child field from the list.
In the Relationship options section, you are able to select the relationship behavior when a record on the parent table is deleted or updated:
•No action: no action is taken when there are changes on the parent table. This is the default option.
•Cascade: automatically deletes all records on the child table when a parent record is deleted. Example: Customer/Contact, when deleting a customer, all of its contacts are also deleted.
•Set null: when a parent record is deleted, all child records related to it get this field set to null. Example: on the Person/Gender deletion, all people related to this record would be set to null.
•Set default: similar to "set null" option, but instead of setting the field to null, it is filled with its default value.
4. The relationship will appear on the diagram, connecting both tables. Relationship lines allow easy visualization of different properties on the relationship, such as:
•Identifying relationships are represented by continuous lines, while non-identifying relationships are represented by dotted lines.
•A crow's foot at the end of the line indicates many records, while single line ends represent a single record.
•A red line represents a weakly defined relationship, missing specific fields, for example.
5. The created relationship will be listed under the Relationship branch of the Data dictionary tree. To edit any of the relationship data, double-click on the relationship on the Project explorer and the Relationship editor will open.
To add notes to a diagram
1. Select Note on the Insert tab on the Design ribbon and release the note on the desired point of the Workspace.
2. You may edit the note by right-clicking on it. The context menu will allow you to Edit text, change color or font and remove the note.
Customizing the diagram
By right-clicking on the diagram's background and objects, context menus allow you to customize many aspects of its visualization and organization.
Background context menu
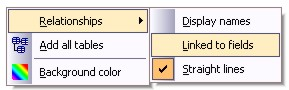
•Background color: changes the Diagram background color.
•Relationships:
oDisplay names: shows each relationship's name next to the relationship line/visual connection.
oLinked to fields: moves the relationship line/visual connection so each end links to the exact related fields on each table. If there are relationships connecting tables through more than one field, the line then links the first field of the relationship, both for parent and for child tables.
oStraight lines: moves the relationship line/visual connection so each line will run straight between the tables, without breaks.
•Add all tables: adds all of the project's tables to the Diagram.
Table context menu
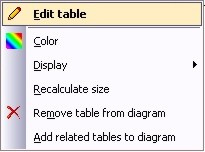
•Edit table: opens the Table editor.
•Color: changes the color on each table's background.
•Display: adjusts the visualization of tables by selecting options on the context menu:
oAll fields: all fields are displayed (default).
oAll keys: only fields on the primary key of the table or foreign key fields are displayed.
oAll primary fields: only fields on the primary key of the table are displayed.
oTable name: only the table name is displayed, no field names.
oShow field types: shows or hides field types.
oRecalculate size: automatically adjusts the displayed table size.
•Remove table from diagram: removes a table from the diagram without deleting it from the project. You can also use the shortcut CTRL+R. By using DEL, you will delete the table from the project.
•Add related tables to diagram: adds to the diagram all tables related to the selected table.
Relationship context menu
•Edit relationship: opens the Relationship editor.
•Color: changes the color on each relationship line.
Note context menu
•Edit text: allows text edition.
•Color: changes the color on a note's background.
•Font: adjusts all font options (face, size etc.)
